In this blog, I will attempt to forecast the outcome of the 2024 US presidential election. As a part of Gov 1347: Election Analytics, I will use data from a variety of sources to develop a compelling model.
This week’s focus is on data from national presidential election outcomes, 1948-2020. Before analyzing the factors leading to a candidate’s victory, it is important to understand past election trends. The objective of this post is to answer two questions in furtherance of this goal: how competitive are US presidential elections, and which states vote blue/red and how consistently. To do so, I’ll examine Electoral College and two-way popular vote outcomes and implement a simplified Helmut Norpoth model for a baseline prediction solely from prior election results.
Popular Vote Over Time
Instead of using national popular vote, a more focused analysis looks at the two-way popular vote, considering only votes cast for the two main parties. I first evaluate how the popular vote distribution has changed between the parties.
From 1948 to 2020, power shifts between Democrats and Republicans occurred every few election cycles. The margins varied significantly, with some elections resulting in large gaps, like the 23.6 percentage-point difference in 1972 between Nixon and McGovern, and others with extremely tight races, like the 0.17 percentage-point margin in 1960 between Nixon and Kennedy. Over the decades, landslide victories have seemingly become less common, with margins still fluctuating but within consistently tighter races.
Electoral College Over Time
The Electoral College also reflects the increased competitiveness seen in popular vote trends. As the true presidential elections determinant, it shows how close they truly were.
The dominance of single parties the Electoral College has similarly declined, with fewer recent landslide victories. This points to an increased competitiveness in presidential elections.
Electoral College Versus Two-Way Popular Vote Share
Close elections often hinge on a few key states in the Electoral College. Later, I investigate trends within swing states. For now, I examine the national electoral votes and two-way popular votes since 1948, comparing the two margins of victory for elections with the largest and smallest margins:
1972 (Nixon vs. McGovern): Nixon won by margin of 23.6 pp and 503 electoral votes.
1964 (Goldwater vs. Johnson): Johnson won by margin of 22.7 pp and 434 electoral votes.
1960 (Nixon vs. Kennedy): Kennedy won by margin of 0.17 pp and 84 electoral votes.
2000 (Bush vs. Gore): Bush lost the two-way popular vote by 0.5 pp but won electoral college by 5 votes.
As in 2000 (and 2016), fluctuations in both electoral and popular vote results are of similar magnitude, but may not lead to the same outcome. These cases demonstrate how the national popular vote and Electoral College results don’t always align, underscoring the importance of state-level popular vote outcomes in predicting elections.
Swing State and Margins Analysis, 1948-2020
To better understand how the popular vote and win margins can effect election outcomes, it’s crucial to analyze changes at the state level. Looking at each state’s swing– the change in the popular vote margin relative to the results in that state from the last election– provides insight into where elections might be won or lost.
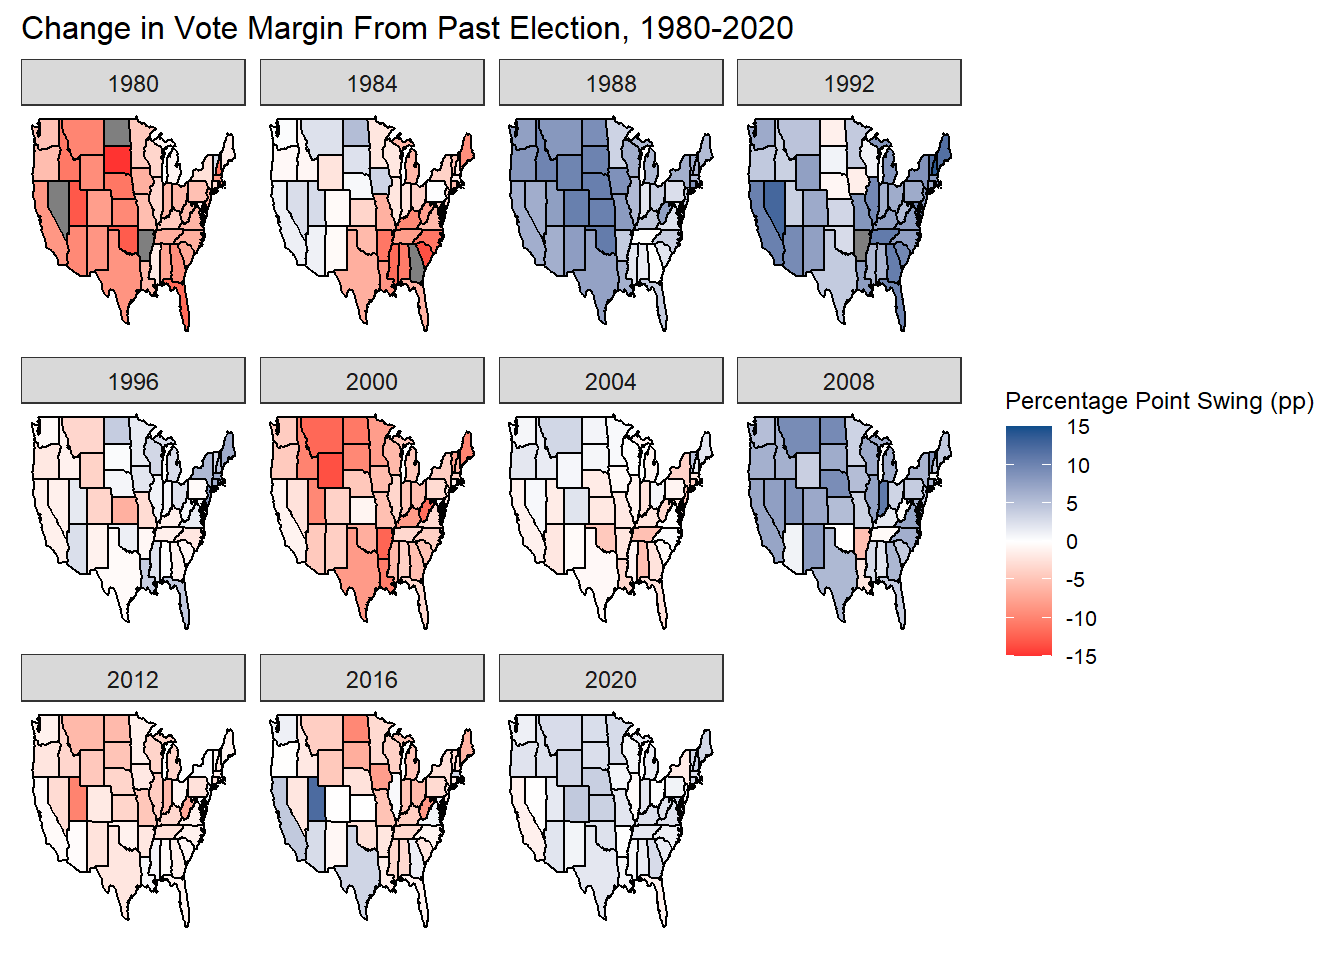
States shaded darker swung more toward Republicans (red) and Democrats (blue) compared to their margins in the past election. Importantly, dark shading does not mean a state is competitive–it is often the opposite.
For instance, Utah, consistently Republican, saw a red swing in 2012 when Mitt Romney, a son of Utah, was the candidate. This made 2016 appear blue due to a smaller Republican margin, but Utah hasn’t voted Democrat since the landslide in 1964, so it is not a swing state.
Conversely, states with consistently smaller swings, like Pennsylvania and Arizona, are more likely to be true swing states. A swing map visualizes only relative support movement, the popular vote within each state remains crucial.
The Helmut Norpoth Model
While swings and margins provide valuable insight, they alone cannot predict outcomes. The same goes for the popular vote nationally, which does not always determine electoral votes. But looking at state-level popular vote can provide an early 2024 election forecast based only on past results using a simplified version of the Helmut Northpoth electoral cycle model. This is defined by
$$ vote_{2024} = 0.75vote_{2020} + 0.25vote_{2016}$$This is a predictive model of the election, using inputs of past election results to predict future outcomes.
States with a small projected margin of victory align with the key battlegrounds in 2024: Arizona, Georgia, North Carolina, Pennsylvania, Wisconsin, Michigan, and Nevada. Examining the projected swing of these states compared to the 2020 election helps reveal in which direction these states are moving.
Most states are projected to swing slightly more Republican in 2024 than in 2020, but this does not indicate Republican victory. In fact, this is consistent with the simplified model, relying 75% on the 2020 results and 25% on the 2016 results in each state. Many states voted more Republican in 2016 than they did in 2020, automatically pulling the modeled swings to the Republicans.
In fact, the model forecasts that Vice President Kamala Harris will win 276 electors to former president Donald Trump’s 262, a democratic victory.
Simplified Model Pitfalls and Future Forecast Additions
While the simplified model offers a basic prediction, it still misses many of the known drivers of voter behavior. A comparison to Fair’s Electoral Models reveals the absence of economic fundamentals. The variables in Fair’s model are all economy-based, instead using the intercept to account for non-economic values like past voting patterns.
Additionally, work by Westwood, Messing, and Lelkes (2020) on the impact of forecasts and Enos and Hersch (2015) on the ineffectiveness of campaign on-the-ground-strategy are not considered.
In future forecasts, I will explore additional factors that are known to influence elections. Currently, the simplified Norpoth model provides a basic 2024 election outcome prediction.
Current Forecast: Harris 276 - Trump 262
Data Sources
- Popular vote by candidate, 1948-2020
- Popular vote by state, 1948-2020
- Electoral College by state, 1948-2020